
Is your $3,195 monthly rent check actually leaving you with a profit, or are the new 2026 California mandates silently draining your bank account? With Tustin vacancy rates sitting at a tight 3.9%, the demand is clearly there, but the math has become more complex than ever. You likely feel the pressure of rising property insurance premiums that now range between $810 and $1,700 annually across the state. Performing a rigorous Tustin rental property cash flow analysis is no longer optional if you want to protect your margins against the 2.000% CPI increase applied to this year’s tax assessments.
We understand the stress of managing maintenance costs while keeping up with new laws like AB 628, which now requires you to provide working stoves and refrigerators. You deserve a management partner who prioritizes True Transparency over guesswork. In this guide, we promise to provide the exact math and local benchmarks you need to project your net monthly profit with total accuracy. We will cover everything from 7.535% investment mortgage rates to the specific documentation required by AB 1950.5, giving you a spreadsheet-ready formula to secure your financial future with confidence.
Key Takeaways
- Learn why the 2026 Tustin supply-demand curve makes cash flow more reliable than appreciation-only strategies in the current interest rate environment.
- Master the step-by-step formula for a Tustin rental property cash flow analysis to ensure you’re accounting for realistic vacancy rates and current market GPI.
- Pinpoint hidden expense spikes, including the specific Mello-Roos assessments in Tustin Ranch and the ongoing Orange County insurance crisis.
- Implement high-yield amenity upgrades and “True” retention tactics that keep your property occupied and your monthly margins healthy.
- Discover how a professional analysis identifies the 20% of costs most DIY landlords miss, backed by our signature “No Hidden Fees” guarantee.
The 2026 Tustin Rental Market: Why Cash Flow Analysis is Critical Now
Tustin’s real estate market in 2026 is a study in resilience, but the old rules of “buy and wait for appreciation” have lost their edge. With investment mortgage rates currently ranging from 7.035% to 7.535%, your debt service is significantly higher than in previous cycles. This financial shift makes a precise Tustin rental property cash flow analysis the only reliable tool to protect your Return on Investment (ROI). While the city maintains a tight 3.9% vacancy rate, the 13,190 renter-occupied households are becoming more discerning about where they spend their median income of $74,760. They expect modern amenities and responsive management, especially as the proximity to the Irvine Spectrum continues to pull high-earning professionals into the local market.
Relying on appreciation-only strategies in today’s high-interest environment is a gamble that most disciplined investors don’t want to take. When your borrowing costs are north of 7%, your monthly margin is the only thing standing between a successful asset and a liability. Tustin’s unique blend of “Legacy” neighborhoods and newer developments creates a fragmented market where rent ceilings are heavily influenced by the high-tech job growth in nearby Irvine. To stay profitable, you must understand how these local variables interact with your specific property type and location.
Old Town Tustin vs. Tustin Ranch: Geographic Yield Variance
Location dictates your margin. In zip code 92780, particularly historic Old Town, landlords often find higher rent-to-price ratios in multi-family units. These properties benefit from a charming “legacy” feel that attracts long-term tenants, though older plumbing and electrical systems require a more proactive maintenance budget. Conversely, Tustin Ranch in 92782 provides high-stability single-family homes. While these properties command premium rents, the initial purchase price and Mello-Roos assessments can compress your monthly yield. We’ve seen that while Tustin Ranch offers lower volatility, the “cash-on-cash” return often peaks in the more established, high-density pockets of the 92780 area.
The 2026 Regulatory Impact on Tustin Landlords
Compliance is no longer a footnote; it’s a major line item in your financial reporting. As of January 1, 2026, new mandates like AB 628 require landlords to maintain working stoves and refrigerators, while AB 1950.5 demands specific photographic documentation for security deposits. These changes directly impact your turnover costs and legal risk profile. Staying ahead of California landlord tenant law is essential to prevent unexpected legal fees from devouring your profits. In this environment, a Tustin rental property cash flow analysis must account for these regulatory “soft costs” that many DIY investors overlook. True Property Management provides the proactive asset protection you need to navigate these local and state-level hurdles without losing your peace of mind.
Step-by-Step: How to Perform a Tustin Rental Property Cash Flow Analysis
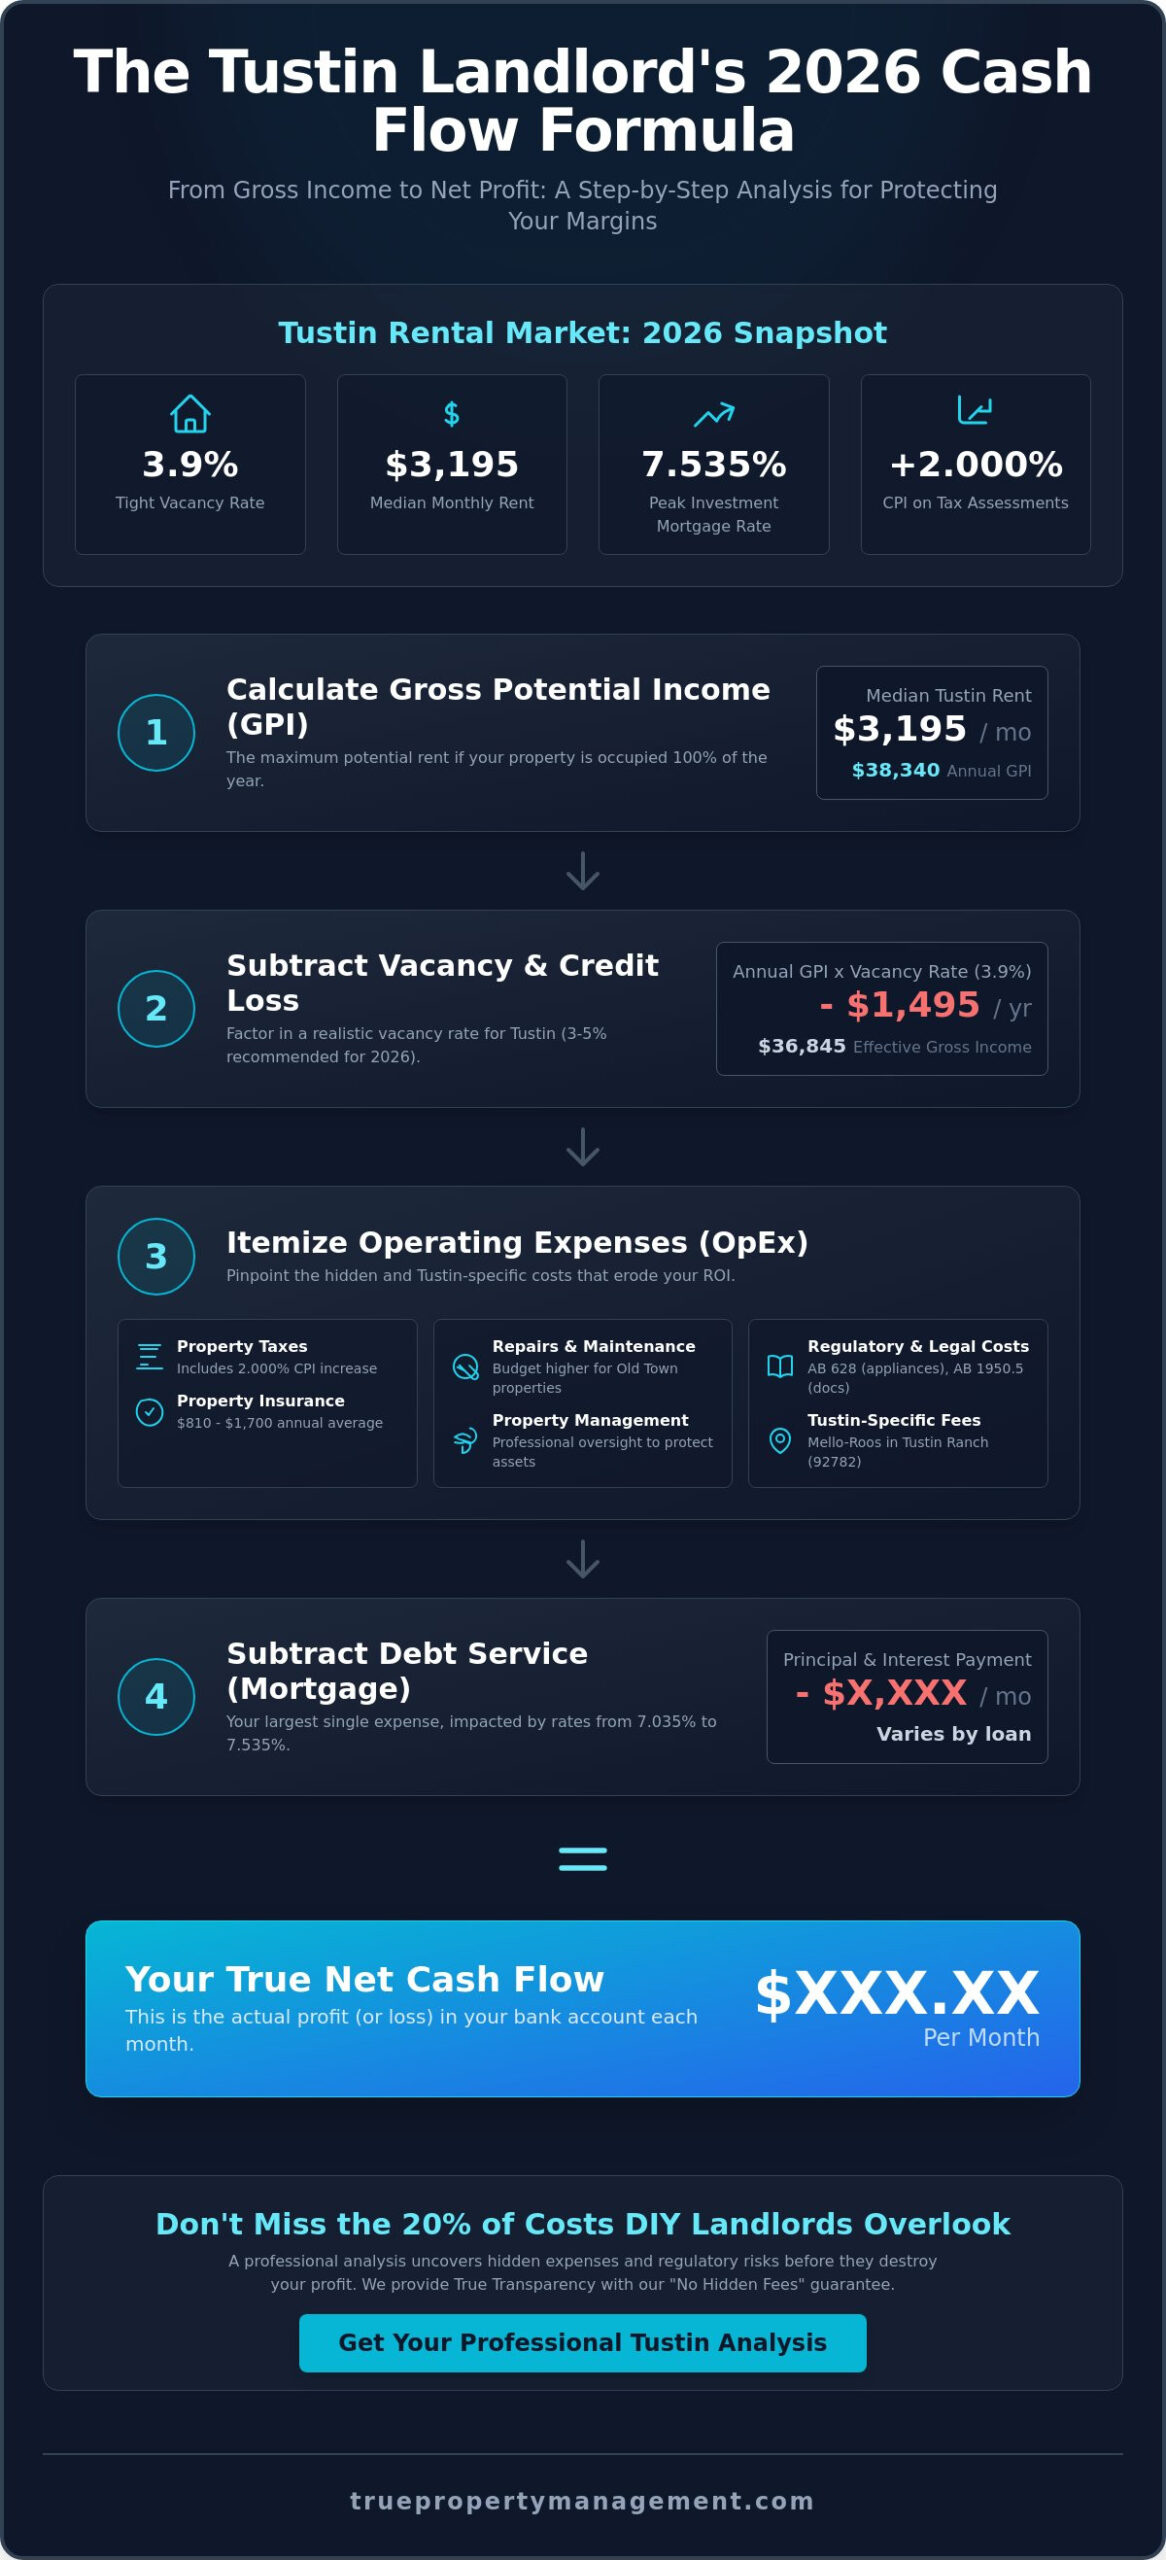
Performing a precise Tustin rental property cash flow analysis is the only way to move from “hoping for profit” to “guaranteeing yield.” In a market where the median rent sits at $3,195, it’s easy to assume you’re in the green. However, without a disciplined approach to the math, high-interest debt and rising OC service costs can quickly erode your margins. We use a repeatable four-step process to ensure every dollar is accounted for before a lease is ever signed.
- Step 1: Calculate Gross Potential Income (GPI) using current Tustin market data.
- Step 2: Factor in a realistic Tustin vacancy rate (we recommend 3% to 5% for 2026).
- Step 3: Itemize every fixed and variable operating expense, from taxes to appliance maintenance.
- Step 4: Subtract your debt service to reveal your actual net monthly cash flow.
Determining Your Gross Potential Income
GPI is the total rent possible if every unit is occupied 100% of the time. To find this number, you must perform a rigorous market rent analysis that compares your specific property to similar units in Tustin zip codes like 92780 or 92782. Don’t leave money on the table; look for additional income streams such as pet rent ($50 to $100 per month) or premium parking fees. These small additions can significantly boost your annual bottom line. If you want a professional set of eyes on your numbers, our team can provide a comprehensive financial review to ensure your income projections are rooted in reality.
The Net Operating Income (NOI) Formula
NOI is the ultimate “truth teller” for Tustin investment health because it measures the property’s ability to generate income regardless of how it’s financed. To find your NOI, subtract all operating expenses (maintenance, management, taxes, and insurance) from your effective gross income. This is different from your final cash flow, which only appears after you subtract your mortgage payments. For a property in Tustin Ranch, you might see a high NOI but lower cash flow due to 7.535% interest rates. Calculating your Capitalization (Cap) Rate, which is your NOI divided by the property’s current market value, allows you to compare your Tustin asset’s performance against other Orange County investment opportunities with True Transparency.
Finally, subtract your debt service from the NOI. In 2026, with 30-year fixed-rate investment mortgages hovering above 7%, this step often determines whether a property is a “hold” or a “sell.” By following this structured analysis, you gain the confidence to adjust rents or cut unnecessary expenses to protect your asset’s long-term viability.
Hidden ROI Killers: Tustin-Specific Expenses to Watch in 2026
A successful Tustin rental property cash flow analysis often hinges on the expenses you don’t see coming. While gross income is easy to track, the “silent” costs of owning property in Orange County have shifted dramatically as of May 2026. Many landlords are currently grappling with the “Orange County Insurance Crisis.” While statewide averages for landlord insurance hover between $810 and $1,700 per year, local premiums are frequently hitting the upper limit of that range. Failing to budget for these spikes can instantly turn a profitable month into a deficit. We recommend a proactive approach that anticipates these 2026 premium increases rather than reacting to a surprise bill at renewal time.
Utility structures also play a major role in your monthly margins. In older multi-family units within the 92780 zip code, landlords often cover water and trash, while single-family homes in Tustin Ranch usually shift these costs to the tenant. If you aren’t careful about how these agreements are structured, a single high-usage month can eat 10% of your net profit. Beyond utilities, the cost of “Turnover Friction” is a significant hurdle. Between deep cleaning, required photographic documentation under AB 1950.5, and minor repairs, a single tenant move can cost upwards of $3,000 in hidden expenses. This is why our focus on True Communication is designed to keep quality tenants in place longer, preserving your cash flow.
Property Tax and Mello-Roos Nuances
Tustin property taxes require more than a surface-level glance. On July 1, 2025, the Orange County Assessor applied a 2.000% increase in the Consumer Price Index to taxable values. While Proposition 13 provides some protection, newer buyers in Tustin Ranch must be particularly wary of Mello-Roos and special assessments. These additional taxes finance local infrastructure and can add thousands to your annual bill. We suggest an annual tax bill audit to ensure you’re not overpaying and to accurately update your Tustin rental property cash flow analysis for the coming year.
Maintenance and Modernization in Tustin
Deferred maintenance is a primary ROI killer in established neighborhoods like Old Town. Reactive repairs in North Orange County are currently 25% more expensive than scheduled upkeep due to labor shortages and rising material costs in 2026. Following a rental property maintenance checklist is the best way to avoid the high cost of emergency calls. By addressing issues like HVAC servicing or roof inspections before they become failures, you protect your asset and maintain the high standards that Tustin renters expect.
Optimizing Your Tustin Cash Flow: 3 Strategies for 2026
Once you’ve completed your Tustin rental property cash flow analysis, the next step is active optimization. Knowing your numbers provides the foundation, but improving them is where you build real wealth. In 2026, successful landlords are moving away from passive management and toward strategic value-creation. We focus on three core pillars that protect your monthly margins while enhancing the long-term value of your asset. These strategies help you stay ahead of the 7.535% interest rate environment by squeezing every bit of efficiency out of your operation.
- Strategy 1: Implement “True” Tenant Retention to eliminate the high cost of vacancy and turnover.
- Strategy 2: Prioritize high-yield amenity upgrades that justify higher rent premiums in the North OC market.
- Strategy 3: Execute strategic expense reduction through vendor consolidation and proactive maintenance scheduling.
Using a “True Communication” model allows you to justify annual rent adjustments by clearly demonstrating the value and property improvements your tenants receive. When renters feel heard and see that their home is being proactively maintained, they’re far more likely to accept market-rate increases without looking for a new place to live. This relationship-based approach is the secret to maintaining a steady, predictable income stream.
Reducing Vacancy: The Ultimate Cash Flow Protector
Vacancy is the single biggest threat to your Tustin rental property cash flow analysis. Every day your property sits empty, you’re losing approximately $106 based on the Tustin median rent of $3,195. Preventing this starts with comprehensive tenant screening to ensure you’re placing reliable individuals who respect your investment. A “Bad Tenant” in Tustin doesn’t just cost you lost rent; legal fees and property damage can easily exceed $10,000 in a single eviction cycle. We market your property specifically to high-earning Irvine professionals who value the proximity and community Tustin offers, ensuring a higher caliber of applicant and longer lease terms.
Value-Add Upgrades for Tustin Rentals
Not all upgrades are created equal. While cosmetic paint is a standard expectation, installing Level 2 EV chargers or smart home thermostats provides a measurable boost in rent premiums for 2026. Tustin townhome residents increasingly prioritize energy efficiency and security tech when choosing a home. A modest $50 per month rent increase covers $6,000 in upgrade costs over 10 years. If you’re looking to maximize your property’s potential, our team can help you identify the most profitable improvements for your specific Tustin neighborhood.
The “True” Advantage: Professional Analysis for Tustin Investors
Many landlords attempt to DIY their Tustin rental property cash flow analysis, but these manual calculations often miss the 15-20% of operational friction that erodes net profit. For instance, the administrative time required to comply with 2026 mandates like AB 1950.5 photographic documentation often goes unbudgeted by independent owners. When you partner with us, your financial outlook moves from a static spreadsheet to a dynamic, real-time strategy. We position professional management as a profit-multiplier. By leveraging our established vendor networks and proactive maintenance coordination, we frequently reduce repair expenses by a margin that offsets the cost of management itself.
Our signature “No Hidden Fees” guarantee serves as the foundation of our partnership. While other management firms in Orange County might surprise you with administrative surcharges or lease-up markups, we prioritize True Transparency. You’ll never have to wonder where your money is going. Our modern Owner Portal provides 24/7 access to your financial reporting, allowing you to track rent collection and disbursements in real-time. This level of organization is a significant asset during tax season, as our detailed accounting ensures you’re capturing every legal deduction available to California investors in 2026.
Transparency in Tustin Management
Understanding the property management fees structure shouldn’t require a law degree. We provide a clear, straightforward breakdown of our costs so you can accurately project your long-term yield. Our 24/7 maintenance coordination is specifically designed to protect your margins. When a plumbing emergency occurs in a 92780 multi-family unit at midnight, you won’t be at the mercy of an overpriced emergency contractor. We utilize a vetted pool of local vendors who provide fair, pre-negotiated pricing, ensuring that a single repair doesn’t derail your entire monthly cash flow.
Next Steps: Get Your Tustin Cash Flow Audit
It’s time to stop guessing and start growing. Transitioning from a stressed DIY landlord to a confident passive investor begins with a professional audit of your portfolio. We invite you to experience the “True” process, starting with a comprehensive review of your property’s current performance. We’ll analyze your rent-to-price ratio against 2026 Tustin benchmarks and identify specific areas where you can reduce waste or increase income. Don’t let another month of “leaky” expenses impact your bottom line. Schedule your Tustin rental property cash flow consultation today and secure the professional protection your investment deserves.
Secure Your Tustin Investment’s Financial Future
Success in the 2026 market requires more than just collecting rent. It demands a disciplined approach to your bottom line. We have explored how a tight 3.9% vacancy rate and 7.535% interest rates redefine what makes a property profitable today. Performing a rigorous Tustin rental property cash flow analysis is your best defense against rising insurance premiums and new regulatory costs. By focusing on Net Operating Income and strategic tenant retention, you transform a high-maintenance asset into a reliable income stream.
True Property Management was founded in 2014 with deep Orange County roots. We provide specialized Tustin and Irvine market expertise backed by our signature No Hidden Fees Guarantee. You deserve a partner who values transparency as much as you value your ROI. Don’t let another month of guesswork impact your portfolio’s performance.
Get Your Free Tustin Cash Flow & Rent Analysis
Your financial peace of mind is within reach. We are ready to help you navigate the complexities of the local market so you can enjoy the rewards of your investment without the logistical headaches.
Frequently Asked Questions
What is a good cash-on-cash return for Tustin rental property in 2026?
A healthy cash-on-cash return in Tustin typically ranges between 4% and 6% given the high property values in Orange County. With current investment mortgage rates sitting near 7.535%, achieving a return above 5% is considered a strong performance for the local market. Your Tustin rental property cash flow analysis should prioritize stability and long-term equity growth alongside these monthly margins.
Does Tustin have rent control ordinances I should know about?
Tustin currently follows the California Tenant Protection Act (AB 1482), which limits annual rent increases to 5% plus the local CPI, or 10% total, whichever is lower. As of May 2026, the city hasn’t implemented any additional local rent control ordinances beyond these state mandates. We closely monitor legislative shifts to ensure your property remains compliant while maximizing your legal rent potential.
How much should I budget for maintenance on an older home in Old Town Tustin?
You should budget approximately 1.5% to 2% of the property’s value annually for maintenance on historic homes in the 92780 zip code. Older structures often face unique plumbing and electrical challenges that require more frequent attention than newer builds. Setting aside these funds proactively prevents emergency repairs from devouring your monthly profit and protects the integrity of your investment.
Can I include Mello-Roos payments in my rental property tax deductions?
Mello-Roos payments are generally not deductible as property taxes on your federal tax return because they’re classified as assessments for local improvements rather than general taxes. While they don’t lower your annual tax liability, they are an essential factor in your Tustin rental property cash flow analysis. These costs are often part of the property’s cost basis, so it’s vital to consult with a tax professional for specific advice.
How does the vacancy rate in Tustin compare to the rest of Orange County?
Tustin’s vacancy rate is currently 3.9%, which is slightly more competitive than the broader Orange County average of 4.2% recorded in early 2026. This tight supply is driven by the city’s proximity to major employment hubs like the Irvine Spectrum. This demand provides landlords with more leverage to select high-quality tenants and maintain steady rental income throughout the year.
Is it better to focus on cash flow or appreciation in the 92782 zip code?
In the 92782 zip code, which includes Tustin Ranch, you should focus on a balance that prioritizes long-term appreciation and high-quality stability. High entry prices and Mello-Roos assessments often compress monthly cash flow compared to other areas. However, these properties tend to attract long-term tenants and show strong historical value growth, making them excellent vehicles for wealth preservation.
What happens to my cash flow if I allow pets in my Tustin rental?
Allowing pets typically increases your net cash flow by $50 to $100 per month through pet rent. Since approximately 70% of renters own pets as of 2026, opening your doors to animals significantly reduces your vacancy time. While you must account for potential wear, our rigorous tenant screening process and security deposit documentation ensure that your asset remains protected from significant damage.
How often should I perform a professional rent analysis for my Tustin property?
You should perform a professional rent analysis at least 90 days before any lease expiration or when preparing a new listing. With Tustin rents increasing by 1.7% over the last year, using outdated pricing data can lead to thousands of dollars in lost annual income. Regular reviews allow you to adjust for 2026 market shifts and keep your investment performing at its peak potential.